Forecast for AUD/USD on November 24, 2020
AUD/USD
The Australian dollar lost 15 points under the overall optimistic pressure of the US dollar on Monday. But while the Australian currency is in no hurry to leave the range of the last six trading sessions, it needs to make sure that the market intends to further strengthen the US currency. During this waiting time, even if it does not work out the upper target of 0.7380, AUD/USD can form a double divergence with the Marlin oscillator. The most important economic data for Australia will only be available next week, such as Quarter 3 GDP, trade balance, PMI, and construction. Since the RBA meeting will take place on Tuesday, December 1, the "kangaroo" can feel quite free until the end of the week.
On the four-hour chart, the price consolidated under the MACD indicator line, the Marlin oscillator briefly went into the negative zone, and this morning it is trying to get back into the growth zone. Neutrality is also observed here on the four-hour scale. It still waits for the price to fall below the level of 0.7260, which is under the daily MACD line.
Analysis are provided by InstaForex
Trading analysis from Instaforex


-
InstaForex Gertrude
- Senior
AUD/USD Forecast for November 25, 2020
AUD / USD
The Australian Dollar successfully took advantage of yesterday's weakness of the US Dollar. On the weakening of the dollar index by 0.40%, 75 points (1.02%) were added to the Australian currency. The price reached the target level of 0.7380 this morning and at the same time formed a triple divergence (on the bodies of candles) with the Marlin oscillator.
With the greatest probability, the price can now turn down with an attack on the support of the Kruzenshtern line (0.7255), which coincides with the level of the lows on November 19 and 10 (and also on September 4).
On the four-hour chart, the price is above the balance line and the Kruzenshtern line. The Marlin oscillator held yesterday's price growth in the sideways direction which may be an early sign of a reversal or correction. Fixing the price under the Kruzenshtern line (0.7342) will be the first sign of a reversal, after which it is advisable to wait for confirmation of this signal and opening short positions. Confirmation may be the departure of Marlin in the negative area, this will be approximately when the price reaches the level of 0.7330.
Analysis are provided by InstaForex
-
InstaForex Gertrude
- Senior
Forex Analysis & Reviews: AUD/USD Forecast for November 26, 2020
AUD/USD
The Australian Dollar was ready yesterday to turn from the target resistance 0.7380, a decline of 50 points, but the European currencies showed the optimism of American investors out of the market before today's holiday. As a result the Aussie closed the day up 5 points. The potential for divergence formation on the daily chart remains. The level of 0.7380 has not been overcome but the probability of this has increased. The target in this case is the 0.7440 level.
On the four-hour chart, the price punctured the Kruzenshtern line twice yesterday but this was in a growing trend, as the price remained above the balance indicator line. The signal line of the Marlin oscillator has created a wedge-shaped structure, from which an upward exit is expected.
So, with a probability of 80%, the price is likely to go above the level of 0.7380 and further increase to 0.7440.
Analysis are provided by InstaForex
-
InstaForex Gertrude
- Senior
Forex Analysis & Reviews: Forecast for EUR/USD on November 27, 2020
EUR/USD
In the absence of American investors in the market, the euro did not dare to overcome the important resistance of the upper line of the price channel on the daily chart on Thursday. Confusion made it possible for a divergence reversal to form with the Marlin oscillator. European stock indexes also showed no desire to rise yesterday, the main ones closed the day with a slight decline. Obviously, the markets will not grow today either, as any negotiations between the UK and the EU on Brexit may end on Monday.
At the moment, the daily price is between the MACD line and the price channel line. The price can't go up, but now it can slightly go down on closing long positions. Direct short deals on the euro may begin next week.
The four-hour chart shows that the price is still receiving support from the MACD line, but the signal line of the Marlin oscillator did not rise from its own range (gray rectangle), as we expected yesterday, but now this line can go down from the range. A signal to open short positions is when the price falls below yesterday's low of 1.1885.
Analysis are provided by InstaForex
-
InstaForex Gertrude
- Senior
Forex Analysis & Reviews: Gold price breaks $1,800
Gold is trading below $1,800 and today it made a new lower low at $1,773. In our latest Gold analysis when price was trading near $1,810-20 resistance area by the bearish channel, we noted the bearish flag pattern and that we expect Gold price to move to new lows towards $1,770-50. The upper side of the target range has been reached today.
Blue lines - bearish channel
Gold price is moving lower in a textbook style as price gets rejected at the upper channel boundary resistance and breaks lower towards $1,770. Trend is clearly bearish and no sign of reversal yet. Gold price will most probably continue lower. A bounce towards $1,800 is not out of the question but it would not be something we would bet on.
Analysis are provided by InstaForex
-
TitanKenneth

- VIP

- Location: New York
wowInstaForex Gertrude wrote:Forex Analysis & Reviews: Gold price breaks $1,800
Gold is trading below $1,800 and today it made a new lower low at $1,773. In our latest Gold analysis when price was trading near $1,810-20 resistance area by the bearish channel, we noted the bearish flag pattern and that we expect Gold price to move to new lows towards $1,770-50. The upper side of the target range has been reached today.
Blue lines - bearish channel
Gold price is moving lower in a textbook style as price gets rejected at the upper channel boundary resistance and breaks lower towards $1,770. Trend is clearly bearish and no sign of reversal yet. Gold price will most probably continue lower. A bounce towards $1,800 is not out of the question but it would not be something we would bet on.
Analysis are provided by InstaForex
Follow me on facebook "Titan Kenneth".
https://mobile.facebook.com/profile.php ... speed_dial
https://mobile.facebook.com/profile.php ... speed_dial
-
InstaForex Gertrude
- Senior
Forex Analysis & Reviews: Forecast for EUR/USD on December 1, 2020
EUR/USD
According to news agencies, stock market participants took profits yesterday, due to which the S&P 500 fell by 0.46%, and the Dow Jones -0.91%. Trading volumes were large, a sign of flight from the stock market before the announcement of the UK's exit from the EU without a deal. The euro lost 35 points on the same expectations, falling from the day's high with 77 points. The price slightly fell short of the target level 1.2010/40. Divergence on the daily chart is gaining strength
Taking the high volumes of yesterday's trading into account, which were the highest for the euro over the past two weeks, investors are unlikely to want to try to take it a second time. Now we are waiting for the price to move under the MACD line (1.1896) and the attack on support at 1.1750. If successful, it will be followed by - reaching the lower embedded line of the price channel in the 1.1620 area.
The four-hour chart shows that the signal line of the Marlin oscillator has returned to the lower border of its own range. At the same time, the price reached the support of the MACD indicator line. Since the price overcame yesterday's low of 1.1926, it is possible to open short deals while aiming for 1.1750 and 1.1620.
Analysis are provided by InstaForex
-
InstaForex Gertrude
- Senior
Forex Analysis & Reviews: Forecast for AUD/USD on December 2, 2020
AUD / USD
The Australian dollar does not share the great optimism of European currencies and went up by only 27 points yesterday, remaining in the range of Monday until this morning. Even on today's GDP data for the 3rd quarter that showed growth of 3.3% against expectations of 2.5%, the "Aussie" did not react and the price is in no hurry to overcome the target level at the resistance of 0.7380.
Yesterday's RBA meeting was cautiously negative as the regulator does not expect the economy to recover until the end of next year. It is very possible that this definition includes a version of a hard Brexit. The double divergence of the price with the oscillator on the daily scale remains. We are waiting for a reversal in the target range of 0.7222 / 52 in the area of the Kruzenshtern line and the price level of the minimum on November 12.
Based on the four-hour chart, the price stopped at the Kruzenshtern line, which strengthened the level of 0.7380. The Marlin oscillator is held in the downward trend zone. Commodities and metals were cheaper yesterday and today keeping the Australian dollar from rising during a period of uncertainty in Europe. We are waiting for a slow decline in the Australian currency to 0.7340 with the overcoming of the level, the fall may accelerate.
Analysis are provided by InstaForex
-
InstaForex Gertrude
- Senior
Forex Analysis & Reviews: Forecast for AUD/USD on December 3, 2020
AUD/USD
The Australian dollar managed to show yesterday another maximum of the last 3 months, which was caused by the growth of the Euro. But this "Australian" strengthened only the spring that is preparing to push down – the Marlin divergence has already become triple. The decline target is seen in the range of 0.7222 / 52, formed by the November 12 low and the Kruzenshtern line.
Based on the four-hour chart, the price is fixed above both the indicator lines - the balance line and the Kruzenshtern line, Marlin indicates growth. But here we see a repeat of the situation in recent weeks, when the price was freely wound on this indicator line in a relatively thin speculative market.
Fixing the price below 0.7384 could mean a start to overcome the level of 0.7340, which will already reveal the downward potential to the full. It is worth noting that the Australian dollar did not react to the excellent trade balance of Australia published this morning and the trade balance for October was 7.46 billion dollars against the forecast of 5.83 billion. Exports increased by 5.0%.
Analysis are provided by InstaForex
-
InstaForex Gertrude
- Senior
Forex Analysis & Reviews: Forecast for EUR/USD on December 4, 2020
EUR/USD
Brexit negotiations are ongoing. Only one agreement reached - to extend the negotiations over the weekend. As a result of this, the dollar index added 0.37%, the euro 32 points. Today we can expect data on labor in the US for November, unemployment is expected to drop from 6.9% to 6.8%, perhaps these data can stop the euro's growth. If investors do not close their long positions today, then they may suffer losses on Monday.
The euro has gone above the target level of 1.2117, reaching the upper level of 1.2230 is questionable, since the Marlin oscillator is turning down on the daily chart. Getting the price to settle under 1.2117 will mean a quick attack on the support line of the price channel at 1.2040, and going under it - falling further to 1.1922 - toward the MACD line.
The signal line of the Marlin oscillator has formed a triple top on the four-hour chart, which is a trend reversal pattern. Getting the price to settle below 1.2117 will make it possible for the price to attack the strong support at 1.2040 formed by the trend line of the higher chart, the low on December 2, approaching the level of the MACD line. Overcoming important support opens the way to 1.1922. We are waiting for the outcome of the Brexit negotiations.
Analysis are provided by InstaForex
-
InstaForex Gertrude
- Senior
Forex Analysis & Reviews: Gold to end the week near intra weekly highs
Gold price made another attempt towards $1,850 today but price got rejected once again. Bulls should get worried if after a rejection price moves away too far from $1,850. Bulls should be worried if after the rejection price breaks below short-term support of $1,820.
Blue rectangle - resistance area
Black lines -Fibonacci retracements
Gold price is trading near but below the key resistance of $1,850-60. This area was once key support and is now key resistance. I do not expect Gold to break this level, at least not now. I believe we will first see a pull back at least towards the 38% Fibonacci level if not towards the 61.8% before the resumption of the bullish move that started last week at $1,763. At current levels I prefer to be neutral if not bearish. Before weekend I avoid opening new positions. That is why I prefer to wait and see how Monday starts before jumping in the market and before choosing sides.
Analysis are provided by InstaForex
-
InstaForex Gertrude
- Senior
Forex Analysis & Reviews: Forecast for GBP/USD on December 8, 2020
GBP/USD
The pound fell by 217 points due to yesterday's news about Prime Minister Boris Johnson's readiness to end the hopeless negotiation process on Brexit. Subsequently, the price won back most of the fall, and the day closed with a black candlestick at 58 points. The MACD line stopped the fall. If the negative Brexit scenario is confirmed (we consider it as the main one), a second attempt to attack the MACD line will be more successful, the target is the 1.3180 level.
The actual target will be the 1.3108 level (November 12 low). The double divergence according to Marlin has worked out, the signal line of the oscillator is about to move into the downward trend zone, which will strengthen the bearish market sentiment.
The four-hour chart shows that the price has settled below the MACD line, yesterday's growth fell slightly short of this line and a reversal is taking place this morning. The first target for support is 1.3290, getting the pair to settle below it will strengthen the decline.
Analysis are provided by InstaForex
-
InstaForex Gertrude
- Senior
Forex Analysis & Reviews: Forecast for EUR/USD on December 10, 2020
EUR/USD
Today is the start of the EU summit, which is maybe the most dramatic event in the past six months. Now, here is a list of issues that are unlikely to find a solution:
Brexit, particularly the approval of a trade agreement that does not exist (Johnson's negotiations with Leyen only ended with the fact that they were postponed until Sunday) EU budget associated with economic stimulation, raising the issue of limiting carbon dioxide emissions Poland and Hungary's veto decision about the 1.8 trillion euro recovery fund Conflict between Greece and Turkey over the latter's violations on oil restrictions and gas exploration in the disputed waters of the Mediterranean Sea
ECB's decision on monetary policy will also be announced today. The officials of the Central Bank say that a decision will be made to increase the QE PEPP program from 1.35 trillion euros up to 2.0 trillion, and the extension of the TLTRO program. At the press conference, Christine Lagarde will likely leave an allowable range in understanding the relation to the base rate, which may be lowered in the near future.
The euro's attempt to consolidate above the level of 1.2117 ended unsuccessfully yesterday, which happened for three consecutive days. Thus, it lost 21 points.
The daily chart shows that the price is directed towards the support of the nested price channel line (1.2037). After breaking through which, it can further decline to the support of the MACD line in the area of 1.1934. Meanwhile, the Marlin oscillator is headed downwards.
The price on the four-hour chart has already settled below both indicator lines, while the Marlin oscillator is developing a downward mood in the negative area. It is likely to overcome the nearest support and further decline to the second target of 1.1934.
Analysis are provided by InstaForex
-
InstaForex Gertrude
- Senior
Forex Analysis & Reviews: Trading signal for GBP/USD for December 10-11, 2020. Focus on Brexit.
British Prime Minister Boris Johnson, European Commission President Ursula von der Leyen and their negotiating teams did not achieve a much-desired breakthrough on Brexit. After concluding that they remain "very separate," the EU and the UK agreed to extend the talks until the end of the weekend. This can further weaken the British pound if they do not reach a deal before the transition period expires.
As talks continue in Brussels, the news is likely to move the British pound. Due to this, the British pound is under downward pressure on the 4-hour technical chart. However, it is facing an upward channel on the 4-hour timeframe and at the 200-day EMA.
Looking up, the resistance is at 1.3360, where the 21-period moving average is located, followed by 1.3427, 6/8 Murray. At the upper target of 1.3549 (7/8 Murray), we should wait until the pound breaks above the 21 day EMA. If so, we can place buy positions with a final target at 1.3670. This boost is sure to appear if good news about Brexit is released.
We gave detailed recommendations and made analysis on Monday and Tuesday. We will leave the links below so that you can review our statistics on GBP/USD. Now if you open a bearish position, you can still hold it until the price touches the 200-day EMA. If the price bounces in this area, we can expect a new upward momentum. If the bearish trend is too strong, we recommend selling the pair with targets at 1.3180 and 1.3060.
The market sentiment in the early American session shows that there are 56% of investors who are selling the pound sterling. If this figure decreases, we could see a bearish breakout of the key level of 1.3220, and the price could fall to the area of 1.3060 in the coming days. So please be careful if you enter the market with to buy. The last opportunity to buy is above the 200 EMA, below this level, the downward pressure may accelerate.
Trading tip for GBP/USD for December 10 – 11
Buy above 1.3360 (EMA 21), with take profit at 1.3427, stop loss below 1.3320.
Buy if the pair rebounds around 1.3255 (trend channel), with take profit at 1.3310 and 1.3360, stop loss below 1.3210.(EMA 200)
Buy if the pair rebounds around 1.3220 (EMA 200), with take profit at 1.3270 and 1.3305 (5/8), stop loss below 1.3180.
Review our analysis for December 08, GBP/USD.
Review our analysis for December 09, GBP/USD.
Analysis are provided by InstaForex
-
InstaForex Gertrude
- Senior
Forex Analysis & Reviews: Forecast for EUR/USD on December 14, 2020
EUR/USD
Prime Minister Boris Johnson's Sunday talks with Ursula von der Leyen ended in the fact that the deadline for the talks was postponed until December 31. It is not entirely clear how the ratification of the agreement will take place, but we believe that with this decision, the parties decided to disguise and soften Brexit without a deal, so as not to bring down the markets and shock the population.
The daily chart shows that the price is staying closer to the upper level of 1.2175, rather than to the support of 1.2037, so there is still a possibility of reaching the upper target of 1.2230 with the divergence forming with the Marlin oscillator. When the price approaches the support of the embedded line of the price channel (1.2037), it will strengthen the option of a reversal from the current levels, without preliminary growth. The current situation is neutral.
The four-hour chart shows that the price has settled below the MACD line, but the signal line of the Marlin oscillator makes an attempt to enter the growth area, and this situation does not provide any advantage to any of the scenarios, the probability of growth and decline is the same.
Analysis are provided by InstaForex
-
InstaForex Gertrude
- Senior
Forex Analysis & Reviews: Forecast for AUD/USD on December 15, 2020
AUD/USD
Over the past day, the situation for the Australian Dollar has not changed. The quote is at the closing level of Friday last week. But in the technical picture, this increased the reversal potential. On the daily scale chart, the divergence from the Marlin oscillator becomes more distinct. To maintain this scenario, the price will need to be fixed under the nearest support of 0.7500.
The four-hour chart has its own divergence, which increases the probability of a reversal from the current levels.
With the price moving below 0.7500 (December 2017 low), the target of 0.7440 opens with intermediate support on the Kruzenshtern line at 0.7468. I think that in the current situation, we can overcome this line without difficulty. If the price moves below 0.7440, the next target would be at 0.7340.
Analysis are provided by InstaForex
-
InstaForex Gertrude
- Senior
Forex Analysis & Reviews: Forecast for AUD/USD on December 16, 2020
AUD/USD
The Australian dollar took advantage once again of the delay in the offensive of the US currency (or does not believe in it) and went up to 26 points yesterday. But this growth in technical terms has not changed anything, the price divergence with the Marlin oscillator remains, the upper and the lower targets remain unchanged. Today, the Fed's FOMC is more likely to announce a reduction in the QE program or at least an intention to do so in January. Such a statement should cool the ardor of speculators. We are waiting for the decline of the Australian to the nearest support of 0.7500 (low of December 2017), then to 0.7440.
Based on the four-hour chart, the Marlin oscillator does not reduce confidence in the downward trend section, declining in its own channel. The Kruzenshtern line is approaching the target level of 0.7500, this level is of particular importance and its overcoming can provoke an accelerated fall in the price.
Analysis are provided by InstaForex
-
InstaForex Gertrude
- Senior
Forex Analysis & Reviews: Ichimoku cloud indicator analysis of Gold
Gold price is once again moving higher above the key resistance of $1,850. If bulls manage to hold above $1,850 and break above recent highs at $1,874, we should then expect a move towards $1,900 and higher.
Gold price has made an important higher low at $1,820 and is now breaking above the Ichimoku cloud once again. This is a bullish sign. Support is at $1,847 and next at $1,820. Gold bulls need to defend these two levels. Breaking below $1,820 will bring Gold price below $1,800. However so far this is not the most probable scenario. The most probable scenario for now is a move above $1,874 towards $1,913-31. Both tenkan-sen (Red line indicator) and the kijun-sen (yellow line indicator) are below price. The Chikou span (black line indicator) is above the candlestick body. This is also bullish. All signs in the 4 hour chart support the bullish case.
Analysis are provided by InstaForex
-
Guest
Forex Analysis & Reviews: Forecast for USD/JPY on December 18, 2020
USD/JPY
Yesterday, the yen moved under the target level of 103.18, but failed to settle below it. This morning the price is already above this level and it may not fall towards the target of 102.35. In order to move to the first target along the MACD line in the 104.10 area, there are still no conditions on the lower timeframe. The situation is neutral.
The growth rates are higher, and being able to settle above the embedded price channel line (104.42), paves the way for the price to reach the upper line of the price channel in the 105.70 area, but it is too early to talk about it. There is a 60% probability that the price can return to the area under 103.18 and continue to decline to the target of 102.35.
The four-hour chart shows that the first reversal signal will appear when the signal line of the Marlin oscillator goes into the positive area, and in order to do so the price needs to rise by about 30 points, which will correspond to the price of 103.60, and this is already close to the MACD line (107.75). When making a decision to buy, we recommend that you wait until the price goes above this indicator line. The current situation is not trading.
Analysis are provided by InstaForex
-
IFX Yvonne
- Junior
Forex Analysis & Reviews: Technical Analysis of ETH/USD for December 21, 2020
Crypto Industry News:
A recently released US Department of Justice audit of the practices of the Federal Bureau of Investigation (FBI) in relation to Darknet criminal investigations found law enforcement in a mess - with an overarching "cryptocurrency support strategy."
According to the public version of the audit released on Thursday, the FBI's current efforts to investigate the Dark Web are - perhaps ironically - hampered by a "decentralized" set of practices, policies and training programs, and fragmented intelligence leading to "redundant" efforts.
In particular, the audit found that there are two separate virtual currency teams to assist with investigations into the Dark Web, both of which are funded by the Department of Justice's Asset Forfeiture Fund. In addition, "rising costs and continued funding from the Fund caused a dispute between the two Virtual Currency Teams on resource prioritization" and many felt the teams were carrying out overlapping work.
The fund receives a portion of its funds by seizing and selling property and assets, including cryptocurrencies, related to criminal investigations. The Department of Justice has issued five recommendations to streamline investigations and policies on the Darknet, many of which focus on centralizing procedures to reduce "ambiguous or overlapping investigative obligations". This includes the recommendation to "develop a timeframe to obtain feedback from the rest of the FBI and complete the development of cryptocurrency support strategies across the FBI." The report also indicated that such a schedule was approaching.
Technical Market Outlook:
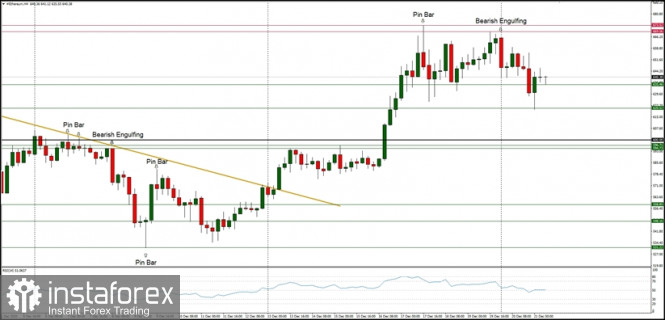
After the ETH/USD pair had made a new swing high at the level of $673.52, the bulls experienced slight problems with momentum. The market has made a Pin Bar candle at the top of the rally at the H4 time frame chart, so now the local pull-back is in progress. The bearish have managed to push the price to the level of $620.52 before the bounce. The momentum has declined, but is still strong and positive, so the bulls might attack the level of $700 again soon. The next technical resistance is seen at the level of $673.52 and the technical support is located at $635.46 and $620.52.
Weekly Pivot Points:
WR3 - $777.02
WR2 - $722.62
WR1 - $678.76
Weekly Pivot - $626.41
WS1 - $580.02
WS2 - $527.98
WS3 - $482.35
Trading Recommendations:
The up trend on the Ethereum continues and the next long term target for ETH/USD is seen at the level of $700, so any correction or local pull-back should be used to open the buy orders. Nevertheless, the momentum has decreased recently on the lower time frames and volatility is not that great either. The bulls has hit the 38% Fibonacci retracement located at the level of $587.87 on the weekly time frame chart, but the current up trend is still active. This scenario is valid as long as the level of $360 is broken.
Crypto Industry News:
A recently released US Department of Justice audit of the practices of the Federal Bureau of Investigation (FBI) in relation to Darknet criminal investigations found law enforcement in a mess - with an overarching "cryptocurrency support strategy."
According to the public version of the audit released on Thursday, the FBI's current efforts to investigate the Dark Web are - perhaps ironically - hampered by a "decentralized" set of practices, policies and training programs, and fragmented intelligence leading to "redundant" efforts.
In particular, the audit found that there are two separate virtual currency teams to assist with investigations into the Dark Web, both of which are funded by the Department of Justice's Asset Forfeiture Fund. In addition, "rising costs and continued funding from the Fund caused a dispute between the two Virtual Currency Teams on resource prioritization" and many felt the teams were carrying out overlapping work.
The fund receives a portion of its funds by seizing and selling property and assets, including cryptocurrencies, related to criminal investigations. The Department of Justice has issued five recommendations to streamline investigations and policies on the Darknet, many of which focus on centralizing procedures to reduce "ambiguous or overlapping investigative obligations". This includes the recommendation to "develop a timeframe to obtain feedback from the rest of the FBI and complete the development of cryptocurrency support strategies across the FBI." The report also indicated that such a schedule was approaching.
Technical Market Outlook:
After the ETH/USD pair had made a new swing high at the level of $673.52, the bulls experienced slight problems with momentum. The market has made a Pin Bar candle at the top of the rally at the H4 time frame chart, so now the local pull-back is in progress. The bearish have managed to push the price to the level of $620.52 before the bounce. The momentum has declined, but is still strong and positive, so the bulls might attack the level of $700 again soon. The next technical resistance is seen at the level of $673.52 and the technical support is located at $635.46 and $620.52.
Weekly Pivot Points:
WR3 - $777.02
WR2 - $722.62
WR1 - $678.76
Weekly Pivot - $626.41
WS1 - $580.02
WS2 - $527.98
WS3 - $482.35
Trading Recommendations:
The up trend on the Ethereum continues and the next long term target for ETH/USD is seen at the level of $700, so any correction or local pull-back should be used to open the buy orders. Nevertheless, the momentum has decreased recently on the lower time frames and volatility is not that great either. The bulls has hit the 38% Fibonacci retracement located at the level of $587.87 on the weekly time frame chart, but the current up trend is still active. This scenario is valid as long as the level of $360 is broken.

-
IFX Yvonne
- Junior
Forex Analysis & Reviews: Forecast for EUR/USD on December 22, 2020
EUR/USD
The euro fell by 126 points on Monday and by the end of the day it practically won back the entire fall. The fall was bought out in large volumes by the largest players in order to avoid an uncontrolled collapse. All this happened on the news about the readiness of British Prime Minister Boris Johnson to back down in the fishing dispute with the EU, setting the quota at 66% of the current volume.
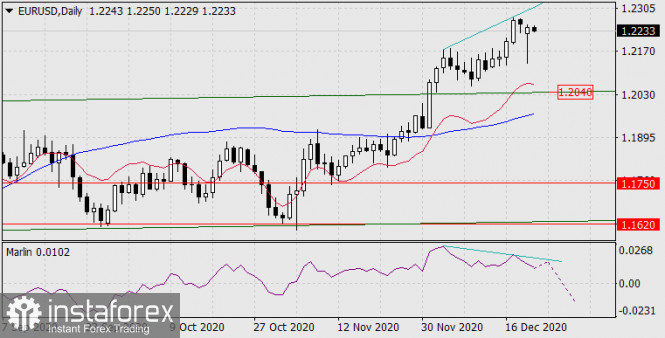
The daily chart shows that the reversal divergence of the price and the oscillator remains. Marlin continued to move down, trying to get out of the growth zone. The downside target at 1.2040 that was formed by the price channel line is still present. However, there is a possibility of forming a double divergence. At the same time, the price will try to rush to the target level of 1.2330 and only then will it reverse into a medium-term decline.
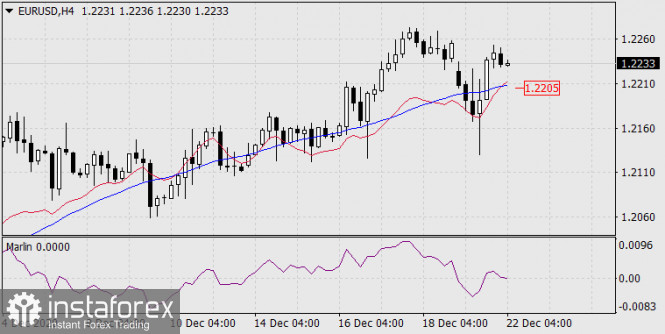
The four-hour chart shows that the price fell below the MACD line, then went back above it, and is currently preparing to move below it. Also, the Marlin oscillator, after the signal line went into the negative area, returned to the growth area and intends to fall again. The condition for accomplishing this move is for the price to fall below the MACD line, under 1.2205. If this condition is not met, then the double divergence option is implemented.
EUR/USD
The euro fell by 126 points on Monday and by the end of the day it practically won back the entire fall. The fall was bought out in large volumes by the largest players in order to avoid an uncontrolled collapse. All this happened on the news about the readiness of British Prime Minister Boris Johnson to back down in the fishing dispute with the EU, setting the quota at 66% of the current volume.
The daily chart shows that the reversal divergence of the price and the oscillator remains. Marlin continued to move down, trying to get out of the growth zone. The downside target at 1.2040 that was formed by the price channel line is still present. However, there is a possibility of forming a double divergence. At the same time, the price will try to rush to the target level of 1.2330 and only then will it reverse into a medium-term decline.
The four-hour chart shows that the price fell below the MACD line, then went back above it, and is currently preparing to move below it. Also, the Marlin oscillator, after the signal line went into the negative area, returned to the growth area and intends to fall again. The condition for accomplishing this move is for the price to fall below the MACD line, under 1.2205. If this condition is not met, then the double divergence option is implemented.
-
IFX Yvonne
- Junior
Forex Analysis & Reviews: Forecast for EUR/USD on December 24, 2020
EUR/USD
The euro gained 23 points on Wednesday, correcting Tuesday's fall. Trading volumes were above average, which may indicate a rapid recovery of long positions. Such a high speculative interest during the Christmas period has not been observed for a very long time. It is a holiday today in Germany and Switzerland, meanwhile, there is a shorter working day in a number of other European countries and in the US. The market is thin, and due to the geopolitical situation, there are good conditions for a strong speculative breakthrough. Almost any reason can be used. It is quite possible to try and make the euro fall towards the target range of 1.1985-1.2042. Of course, there may not be such an attack, but this year, the situation itself has been pushing market players to organize fireworks for the market.
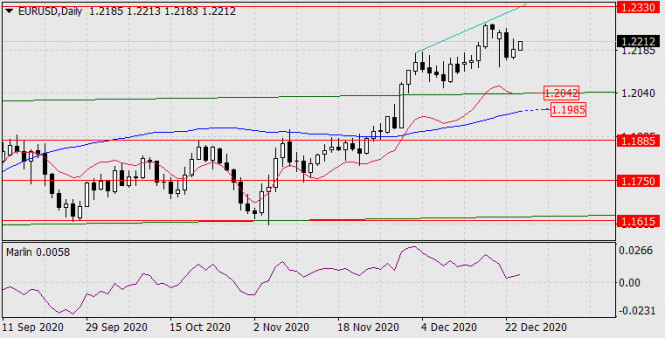
The daily chart shows that the situation has not changed over the day - the Marlin oscillator also tends to go into the negative zone.
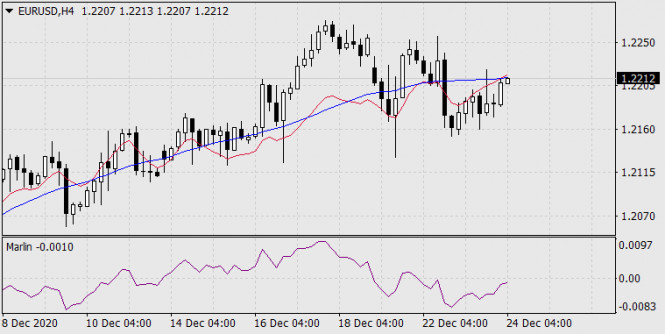
The four-hour chart shows that the price is trying to break out of the resistance of the MACD line, the Marlin oscillator is still in the downward trend zone, but shows an intention to move into an upward trend. If such a pattern does occur, it will most likely turn out to be false, since there are no fundamental conditions for targeted purchases. Even today, US durable goods orders for November are forecast to rise 0.7%.
In general, we recommend skipping buy signals and waiting for a reverse sell signal.
EUR/USD
The euro gained 23 points on Wednesday, correcting Tuesday's fall. Trading volumes were above average, which may indicate a rapid recovery of long positions. Such a high speculative interest during the Christmas period has not been observed for a very long time. It is a holiday today in Germany and Switzerland, meanwhile, there is a shorter working day in a number of other European countries and in the US. The market is thin, and due to the geopolitical situation, there are good conditions for a strong speculative breakthrough. Almost any reason can be used. It is quite possible to try and make the euro fall towards the target range of 1.1985-1.2042. Of course, there may not be such an attack, but this year, the situation itself has been pushing market players to organize fireworks for the market.
The daily chart shows that the situation has not changed over the day - the Marlin oscillator also tends to go into the negative zone.
The four-hour chart shows that the price is trying to break out of the resistance of the MACD line, the Marlin oscillator is still in the downward trend zone, but shows an intention to move into an upward trend. If such a pattern does occur, it will most likely turn out to be false, since there are no fundamental conditions for targeted purchases. Even today, US durable goods orders for November are forecast to rise 0.7%.
In general, we recommend skipping buy signals and waiting for a reverse sell signal.
-
IFX Yvonne
- Junior
Forex Analysis & Reviews: Forecast for USD/JPY on December 25, 2020
USD/JPY
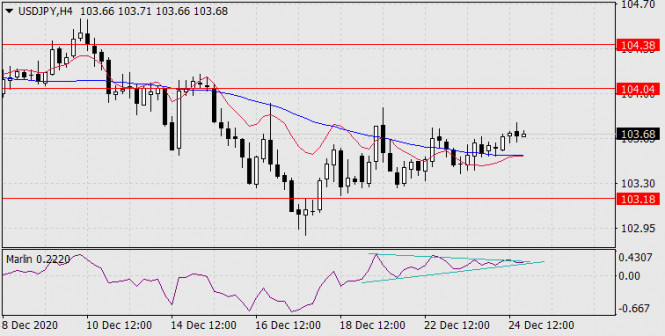
USD/JPY gained 13 points within the trading range of the last three days. Today the Japanese trading floors are open, at the moment the pair is quoted at 103.54, that is, it is already 14 points lower than yesterday's close. Japanese investors seem to be preparing for a negative turn of events from the opening of the new week. We keep our previous forecast that the price will move under the 103.18 level and its successive decline to 102.35.
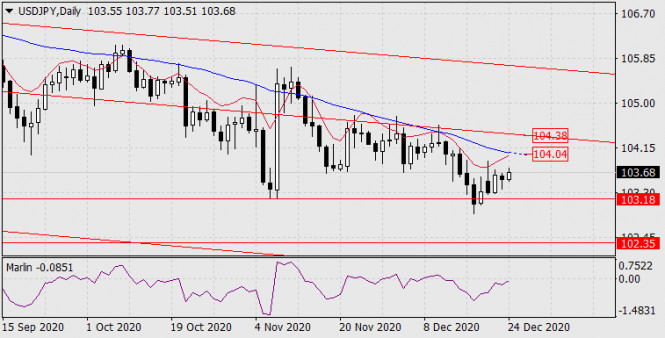
The four-hour chart shows that the signal line of the Marlin oscillator has already reached the top of its own wedge. Exit from the wedge, respectively, we wait downward, the oscillator will soon leave the negative zone and accelerate the fall.
USD/JPY
USD/JPY gained 13 points within the trading range of the last three days. Today the Japanese trading floors are open, at the moment the pair is quoted at 103.54, that is, it is already 14 points lower than yesterday's close. Japanese investors seem to be preparing for a negative turn of events from the opening of the new week. We keep our previous forecast that the price will move under the 103.18 level and its successive decline to 102.35.
The four-hour chart shows that the signal line of the Marlin oscillator has already reached the top of its own wedge. Exit from the wedge, respectively, we wait downward, the oscillator will soon leave the negative zone and accelerate the fall.
-
InstaForex Gertrude
- Senior
Forex Analysis & Reviews: Forecast for EUR/USD on December 28, 2020
EUR/USD
No significant changes in the market over the past four holidays. The market is thin, and after tense expectations about Brexit, investors want to be compensated for their efforts. Therefore, the price breakdown, which we expected earlier, is possible. If there is no breakout, then we are waiting for calmer movement to the first target of 1.1995 - this is the support of the MACD line on the daily chart. For a more stable decline in price, the transition of the Marlin oscillator to the zone of negative values is not enough. This may happen after the quotes drop below 1.2150.
The four-hour chart shows that the euro's general sentiment is for it to fall, but the signal line of the Marlin oscillator is bent up suspiciously strongly, indicating an intention to enter the positive zone. If this happens, then the price will also surpass the MACD indicator line to the upside, which will entail some more growth in the free roaming area, because the market remains thin. Until it ceases to freely roam around (which will not be long), we are waiting for the downward trend to resume for all indicators.
Analysis are provided by InstaForex
-
IFX Yvonne
- Junior
USDCAD is facing bearish pressure, potential for further downside!

Price is facing bearish pressure from our first resistance in line with our horizontal swing high resistance, 78.6% fibonacci retracement and 78.6% fibonacci extension where we could see a drop below this to our first support target.
Trading Recommendation Entry:
1.2790
Reason for Entry:
horizontal swing high resistance, 78.6% fibonacci retracement and 78.6% fibonacci extension
Take Profit: 1.2745
23.6% fibonacci retracement
Stop Loss: 1.2832
Reason for Stop Loss:
horizontal swing high resistance
*The market analysis posted here is meant to increase your awareness, but not to give instructions to make a trade.
-
InstaForex Gertrude
- Senior
Forex Analysis & Reviews: Forecast for AUD/USD on January 19, 2021
AUD / USD
Yesterday, the Australian dollar fell slightly under the strengthening of the US currency. Today, the major currency pairs are undergoing a correction as the US dollar is weakening and counter dollar currencies are strengthening. The growth of the "Australian" today has already blocked yesterday's decline in the Asian session. After the correction is completed with the price overcoming the target level of 0.7641, it will most likely increase the fall to the target of 0.7465, which is approaching the Kruzenshtern line. The Marlin oscillator is in the negative zone and this circumstance will restrain the growth of the currency.
Based on the four-hour scale, the Marlin oscillator makes its way into the growth zone, strengthening the previously formed convergence. The end of the corrective growth is expected on the Kruzenshtern line in the area of 0.7743. Growth is also possible above the target level of 0.7770. The nature of the development of the oscillator indicates the completion of the correction tomorrow.
Analysis are provided by InstaForex
-
InstaForex Gertrude
- Senior
Forex Analysis & Reviews: Forecast for USD/JPY on January 20, 2021
USD/JPY
Yesterday, the USD/JPY pair rose by 20 points without working out the trend line of the price channel of the higher timeframe (104.20). This creates a prerequisite for a repeated attack of the price on this resistance in the near future. The price is higher than the balance indicator line. If the quote moves below the signal level 103.57, which coincides with the support of the Kruzenshtern Indicator line (blue), it will create a condition for the implementation of an alternative scenario where there will be a decline to the level of 103.00.
On the four-hour scale chart, the price breaks under the Kruzenshtern line. The Marlin Oscillator turns down from the border with the growth territory. A price decline to at least 103.57 is possible, after which we also expect a rapid increase to 104.20.
Analysis are provided by InstaForex
-
InstaForex Gertrude
- Senior
Forex Analysis & Reviews: Forecast for AUD/USD on January 21, 2021
AUD/USD
Yesterday and this morning, the Australian Dollar rose by almost 80 points. Today, positive data was released on employment. Unemployment in Australia fell from 6.8% to 6.6%, while the share of the economically active population increased from 66.1% to 66.2%. Fixing the price above 0.7770 may lead the dollar to the target level of 0.7905. The Marlin Oscillator, which has moved into the growth zone, pushes the price to this level.
On the four-hour scale chart, the price is already fixed above the Kruzenshtern Indicator Line. The price remains to gain a foothold above the reached level of 0.7770. If the price does not succeed and the consolidation occurs under the Kruzenshtern line below the level of 0.7744, the scenario for growth will be cancelled. The price will again pay attention to the target level of 0.7641.
Analysis are provided by InstaForex
-
InstaForex Gertrude
- Senior
Forex Analysis & Reviews: Overview of the EUR/USD pair. January 22. The euro currency shows its readiness to return to 2.5-year highs.
4-hour timeframe
Technical details:
Higher linear regression channel: direction - upward.
Lower linear regression channel: direction - downward.
Moving average (20; smoothed) - sideways.
CCI: 105.3571
The EUR/USD currency pair on Thursday, January 21, waited for half a day for the results of the meeting of the European Central Bank. And when they were announced, it turned out that there was not much to react to. But more on that below. From a technical point of view, the euro/dollar pair has consolidated above the moving average line, so the trend on the 4-hour timeframe has changed to an upward trend. So what can we expect now? How is the pound/dollar pair moving? According to the technique, everything now looks like this: there was a downward correction of almost 300 points within the upward trend. Therefore, now is the time to resume the upward trend. Of course, this is still only a hypothesis, but given the continuing weak demand for the US currency and the complete disregard for the fundamental background, this is the conclusion that suggests itself.
Let's go back to the ECB meeting and its results. Here, all the results can be described in one sentence: the regulator left the monetary policy parameters unchanged. None of the traders expected that the ECB at the first meeting in 2021 will change the rate or begin to further increase the quantitative easing program or its "emergency counterpart" - the PEPP program. Thus, the interest rate on loans remained at 0%, on deposits - at -0.5%, and the volume of the PEPP (Pandemic Emergency Purchase Program) – at 1.85 trillion euros. Perhaps there is nothing more to say here. The fact that traders reacted to this news with purchases of the euro currency has no connection at all with what is happening. Simply put, this was not the reaction of traders to the ECB meeting. Let's get this straight: 90% of the time, almost any instrument moves either up or down. That is, the upward movement on January 21 may be a simple coincidence. The markets were going to buy the euro currency without the ECB meeting, that's all. There was nothing to react to. The ECB has not made any changes to monetary policy.
Therefore, you can forget about the meeting and focus on the problems of the Eurozone. Because there are now much more of them than, for example, the American economy. The problem of high public debt in the United States is already something of a byword. This problem has been discussed by all experts, economists, and analysts for a couple of decades. However, along with this "unsolvable" problem, the American economy continues to grow and remains in first place in the world. Yes, some studies suggest that in 10 years or so, the Chinese economy may come out on top in the world in terms of size. However, this is still written with a pitchfork on the water. No one knows what will happen in 10 years. Could anyone have predicted the "coronavirus"? Yes, new viruses and diseases appear from time to time on the planet Earth, but who could have predicted that the whole world would be mired in a pandemic for a whole year? And it's not over yet. Thus, we would recommend paying attention to indicators that reflect the state of the economy here and now. The eurozone also has enough debt. They are not so huge, but they are. For example, only the eurozone recovery fund for 750 billion euros will be formed from borrowed funds, which will be returned for several decades. These are the same debts.
But we look at the GDP forecasts for the fourth quarter and see: -2.2% is forecasted in the Eurozone; +4.2% - +4.4% is forecasted in the United States. Thus, despite all the problems, despite the first place in the world in the number of cases of coronavirus, despite the first place in the world in the number of deaths from COVID, despite the lack of a package of assistance to the economy, the unemployed and businesses, it is the American economy that continues to recover after the second quarter of 2020, while the European economy will again shrink. Naturally, this is due to the second "lockdown", which was in the EU, but not in the United States. However, what difference does it make between the economies for such an imbalance in the fourth quarter? The fact remains.
But despite this, the European currency as a whole continues to grow. It is still very difficult to find any reasons for the strengthening of the euro and the fall of the US dollar. We have already talked about the economy. There are no serious geopolitical problems now either in the EU or in the United States. Moreover, it is the European Union that has recently lost part of its "own" territory (Great Britain). There is one less country in the European Union. And not just for one country, but for a country with an economy in the TOP 10 in the world. However, before and after Brexit, the European currency continued to grow. Political problems, crisis? Yes, it was in the States for almost all of 2020. In Europe, there were other problems, but they were successfully resolved. But the European currency can not grow for about 10 months just because of the political crisis in the United States.
Therefore, based on all of the above, we can conclude that the factors that push the euro up and the dollar down do not lie on the surface. First, it may be a speculative factor, which we have already discussed. First, the upward trend began, and it began quite rightly (four types of crises in the US in 2020, which even Joe Biden recently announced). And in recent months, traders buy the euro and get rid of the dollar. The second hypothetical reason may lie in the plane of large players. We have repeatedly said that small traders do not make any weather in the market. Markets are driven by big players. This, of course, is not one or two central banks. There are thousands of them, but still not millions. And their volumes are different. Thus, it is quite possible that in the highest circles they have completely different information that is not available to ordinary traders. Based on this information, transactions for the sale of the dollar can be made. The third possible reason is purely technical. If you look at the monthly timeframe, it becomes clear that the euro currency has been falling in price for 12 years. For a global trend, a period of 10-12 years is the ideal time to complete. Thus, now may be the time for a long-term upward trend in the euro (from 2000 to 2008, the euro rose in price), or it is time for a technical correction to the area of the level of 1.4000. Of course, confirmation of these assumptions will be extremely difficult to obtain. Therefore, as before, we recommend following the trend, and not trying to guess the reversal, especially long-term. It is better to settle for less profit than to lose everything.
The volatility of the euro/dollar currency pair as of January 22 is 70 points and is characterized as "average". Thus, we expect the pair to move today between the levels of 1.2083 and 1.2223. A downward reversal of the Heiken Ashi indicator may signal a new round of downward correction.
Nearest support levels:
S1 – 1.2085
S2 – 1.1963
S3 – 1.1841
Nearest resistance levels:
R1 – 1.2207
R2 – 1.2329
R3 – 1.2451
Trading Recommendations:
The EUR/USD pair has consolidated above the moving average. Thus, today it is recommended to stay in long positions with targets of 1,2207 and 1,2223 until the Heiken Ashi indicator turns down. It is recommended to consider sell orders if the pair is fixed back below the moving average with a target of 1.2085.
Analysis are provided by InstaForex
-
InstaForex Gertrude
- Senior
Forex Analysis & Reviews: Forecast for EUR/USD on January 25, 2021
EUR/USD
As we expected in last Friday's review, the euro settled in the 1.2132/77 range. The trading volumes were similar to those of the previous two days, that is, purchases were indeed closed, but not as intensely as we expected. Today this process may continue, which can be helped by the German IFO indices for January; the forecast for the business climate assumes a decrease in the index from 92.1 to 91.8, the index of current expectations may decrease from 91.3 to 90.6.
The daily chart shows the price met the resistance of the balance indicator line and the upper border of the consolidation range of 1.2132/77. The Marlin oscillator is turning to the downside. We are waiting for the price to leave the area under the lower border of the consolidation range and a subsequent attack on the MACD line in the 1.2070 area, getting the price to settle below it opens the 1.1915 target.
The four-hour chart shows that the 1.2132 level coincides with the MACD indicator line, respectively, the level, like the consolidation range itself, gains strategic importance in the short-term current situation.
Analysis are provided by InstaForex
-
InstaForex Gertrude
- Senior
Forex Analysis & Reviews: Forecast for GBP/USD on January 26, 2021
GBP/USD
Yesterday, the British pound tested support at 1.3648. So far it has been unsuccessful and there are several technical reasons for this; the signal line of the Marlin oscillator met the lower line of its own wedge on the daily chart; on the four-hour chart, the MACD line is located at this price level.
But Marlin has penetrated the negative area in the four-hour chart, this is a sign that the price would overcome support at 1.3648, probably by today. The target for the decline is the 1.3480 level - the low on December 9 and September 1, 2020.
The four-hour chart shows that the 1.2132 level coincides with the MACD indicator line, respectively, the level, like the consolidation range itself, gains strategic importance in the short-term current situation.
Analysis are provided by InstaForex
-
InstaForex Gertrude
- Senior
Forex Analysis & Reviews: Trading plan for EURUSD for January 27, 2021
Technical outlook:
EURUSD dropped to 1.2108 lows yesterday before finding support again. It is quite possible that the European currency has managed to carve a higher low and bulls are now inclined to extend the counter trend rally towards 1.2250/70 in the near term. The single currency pair is seen to be trading at around 1.2163 levels at this point in writing and is expected to continue pushing higher towards 1.2250/70 levels before resuming lower again.
Immediate resistance remains fixed at 1.2350 mark, while interim support comes in around 1.2053 levels respectively. The recent boundary which is being worked upon is between 1.2350 and 1.2053 and the fibonacci 0.618 retracement is seen towards 1.2250 levels respectively (not shown here). High probability remains for a bearish reversal, if prices manage to reach through 1.2250/70 zone. Bears are expected to be back in control until prices stay below 1.2350 highs.
On the flip side, even if prices break above 1.2350 in the near term, upside remains limited and a sharp bearish reversal could be underway. The larger wave structure also remains constructive for bears since the entire rally between 1.0636 and 1.2350 seems to be complete. Probability remains high for a drop through 1.1250/1.1300 levels, which is fibonacci 0.618 retracement for the above rally.
Trading plan:
Remain short, add more @ 1.2250/70, stop @ 1.2500, target is open.
Good luck!
Analysis are provided by InstaForex
-
InstaForex Gertrude
- Senior
Forex Analysis & Reviews: Forecast for EUR/USD on January 28, 2021
EUR/USD Yesterday, the euro's situation developed according to our main scenario without a false upward surge. And the euro was pushed to this scenario by a member of the European Central Bank's governing council, Klaas Knot, by announcing the possibility of lowering the rate to increase inflation. The business media did not believe Knot, because no one doubts the growth of inflation without the influence of the changed rates due to the continuing pumping of markets with unsecured liquidity. Most likely, the ECB is simply trying to hint about the high rate of the euro. One way or another, but the investors reacted unequivocally - they began to sell the euro. Federal Reserve Chairman Jerome Powell spoke in an optimistic vein regarding the prospects for the economy. He said that the economy has proved to be very resilient to blackouts, it will grow in the second half of the year, and the asset buyback program will continue "as long as necessary" and investors will be warned in advance about the central bank's intention to begin its reduction. This time investors correctly understood Powell's words - if the economy is doing well, then the Fed will issue a "warning" in the foreseeable future. Fourth quarter US GDP, trade balance and new home sales are due today. All indicators are expected to grow.
The price stopped at the MACD indicator line on the daily chart. If the price moves below it, under yesterday's low (1.2058), the target opens at 1.1915 - the peak of four local highs: November 9, September 10, August 6, July 31.
The price settled below the MACD line on the four-hour chart, the Marlin oscillator is declining. We are waiting for the price to overcome the signal level of 1.2058 and the succeeding fall of the EUR/USD pair.
Analysis are provided by InstaForex
-
InstaForex Gertrude
- Senior
Forex Analysis & Reviews: Forecast for EUR/USD on January 29, 2021
EUR/USD
Yesterday, the euro slightly corrected after the hype of Wednesday's fall, supported by the MACD line on the daily chart. Yesterday's growth was offset by a decline in today's Asian session. It looks like the euro is going to attack the support of the MACD line at 1.2077. Getting the price to settle below this line will further strengthen the euro's decline to the target range of 1.1870-1.1915. Interim target of 1.1980.
The price is breaking the support of the MACD line on the four-hour chart. Ahead of it there is a range of support at 1.2058/77, leaving it will become a signal to reach the nearest target of 1.1980.
Analysis are provided by InstaForex
-
InstaForex Gertrude
- Senior
Forex Analysis & Reviews: Forecast for EUR/USD on February 1, 2021
EUR/USD
The euro traded in a limited range last Friday, as it did on Thursday, staying between the MACD indicator line (1.2080) and the reference level of 1.2177 on the daily chart. Here we see that at the moment the Marlin oscillator's indicator line is slightly increasing, which will make it possible for the price to continue consolidating for at least tttday. The euro will accelerate its decline only when the price goes under the MACD line, below 1.2080. The first target is 1.1980, then the range is 1.1870-1.1915.
The price is also developing above the MACD indicator line on the four-hour chart. The 1.2080 level coincides with the lows of January 28 and 20, which makes it more significant. The Marlin oscillator is growing, reaching the border of the territory of positive values. The sideways movement of the euro is likely to continue today.
Analysis are provided by InstaForex
-
InstaForex Gertrude
- Senior
Forex Analysis & Reviews: Forecast for EUR/USD on February 2, 2021
EUR/USD
Yesterday, the euro finally decided to overcome the support of the MACD indicator line. The euro fell by 75 points. Now the 1.1980 target is open. The 1.1870-1.1915 range, which is the second target, is just below it. A weak risk of such a decline is seen in the initial stage when forming a price convergence with the Marlin oscillator. But this is still an alternative to today's scenario.
The situation is completely decreasing on the four-hour chart; the price is below the balance and MACD indicator lines, while the Marlin oscillator is in the zone of negative values, there is no convergence according to Marlin. Since the price surpassed yesterday's low (1.2056), we are waiting for it to move to the first target of 1.1980.
Analysis are provided by InstaForex
-
InstaForex Gertrude
- Senior
Forex Analysis & Reviews: Forecast for EUR/USD on February 3, 2021
EUR/USD
Yesterday, the euro settled below the MACD indicator line on the daily chart. This suggests that now the road to a medium-term decline with the 1.1760 target and, probably, below, in the target range of 1.1550/75 is open. The goals are still to be specified.
But at the moment there is a circumstance that can disrupt the plan to pull down the price to the nearest targets: 1.1980 and 1.1915. This is a sign of the price convergence with the Marlin oscillator. If this convergence is completed and it turns out to be strong, the price will be able to return to the area above the MACD line and then a new downward momentum will be carried over for several more days. In the meantime, the correction is limited by the resistance of the MACD line at 1.2083.
There are no clear reversal signs on the 4-hour chart. The Marlin oscillator is growing in a downward trend zone. The price and the oscillator are growing within a moderate correction. The main scenario - the imminent end of the correction and the price falling to the first target of 1.1980 and to the second target at 1.1915 has higher chances, about 70%.
Analysis are provided by InstaForex
-
InstaForex Gertrude
- Senior
Forex Analysis & Reviews: Technical Analysis of GBP/USD for February 4, 2021
Technical Market Outlook:
The bearish pressure on GBP/USD has increased and the market has broke below the technical support located at the level of 1.3608. This level will now act as an intraday technical resistance. The local low was made at the level of 1.3586, so the next target for them is the intraday technical support located at the level of 1.3519. The market is coming off the overbought conditions and the momentum is weak and negative, pointing down. The key mid - term technical support is seen at the level of 1.3428, but please pay attention to any breakout below the trend line support around the level of 1.3500 first. This might be the first indication of a potential move lower.
Weekly Pivot Points:
WR3 - 1.4011
WR2 - 1.3877
WR1 - 1.3788
Weekly Pivot - 1.3646
WS1 - 1.3564
WS2 - 1.3416
WS3 - 1.3342
Trading Recommendations:
The GBP/USD pair keeps developing the up trend and the trigger for this trend was the breakout above the level or 1.3518 on the weekly time frame chart. The recent top was made at the level of 1.3744 and this was the higher close in over two years. All the local corrections should be used to open a buy orders as long as the level of 1.2674 is not broken. The long-term target for bulls is seen at the level of 1.4370.
Analysis are provided by InstaForex
-
InstaForex Gertrude
- Senior
Forex Analysis & Reviews: Forecasts for GBP/USD on February 5, 2021
GBP/USD
The Bank of England kept its monetary policy at yesterday's meeting, but announced that it does not consider negative rates as a mandatory instrument and will not introduce them without warning at least six months in advance. The verbal attack was successful, the pound jumped 130 points from the day's low, closing the day by 27 points. This morning, inertial growth continues, but it is unlikely to be significant, as in the evening US employment data and forecasts for them are optimistic: the growth of jobs in the non-agricultural sector is expected to 50,000 after December - 140,000. The Marlin oscillator continues to move sideways on the daily chart. The task is the same - to gain a foothold below the 1.3648 level, in order to calmly go to 1.3550 and 1.3500.
The price went above the MACD line on the four-hour chart this morning, while Marlin is in the growth zone. The price may rise to the local high of 1.3710 before the release of US statistics.
Analysis are provided by InstaForex
-
InstaForex Gertrude
- Senior
Forex Analysis & Reviews: Forecast for AUD/USD on February 8, 2021
AUD / USD
The Australian dollar rose by 77 points last Friday, breaking the level of 0.7641. Now, you should wait for the price to go back under this level so that you can start selling again. Today, the important macroeconomic data are not released, and the weakened indicators on the trade balance in Germany are expected tomorrow, which can move European currencies going down even more and along with them the "Australian" will weaken.
As we can see on the daily chart, the signal line of the Marlin oscillator has almost reached the upper limit of its own descending channel, and here the indicator may linger.
Based on the four-hour chart, the price is fixed above the indicator lines of the balance and the Kruzenshtern line. The Marlin is at the top but it is turning slightly. It is quite possible that the AUD/USD pair will have enough potential to stay here for a day.
Analysis are provided by InstaForex